A Couple of Links…

The Key to Electric Cars Is Batteries. One Chinese Firm Dominates the Industry.

I think CATL’s story follows the typical Asian development playbook. First, channel state support, resources, and finances to a key strategic sector:

Beijing rolled out a subsidy program starting in 2013 to encourage local and foreign auto makers to sell more EVs. China promoted EVs as part of a program to boost its capabilities in future industries, and as a way to combat pollution and reduce its dependency on foreign oil.

Secondly, support domestic players and shield them from foreign competition as they ramp up the learning curve:

As the market took off, in 2015, the government told auto makers they would only qualify for subsidies if they used batteries from a list of approved suppliers, which included dozens of Chinese firms but excluded foreign ones.

Later, once these companies are more mature and “ready to leave the nest,” implement export discipline. This exposes domestic companies to foreign competition and culls out the weaker players. The state will then have a better understanding of where to channel its resources to: the domestic players that are able to compete on a global platform:

Though inferior to top Korean and Japanese batteries by some measures, CATL batteries outperformed Chinese alternatives in output and stability, and were available at a scale few others could match, the former GM executive said. Many other local players struggled to stay afloat.

Slowly introducing greater competition allows the top domestic players to catch up to foreign competition:

In June [2019], Beijing announced plans to scrap its controversial restrictions on foreign EV batteries and reopen its market to the big Korean and Japanese players.

South Korea’s Samsung & Hyundai and Japan’s Toyota are a few examples of companies that have developed from this playbook. The result?

CATL in 2018 produced 27 gigawatt hours, according to Benchmark Minerals Intelligence, and plans to add about 20 gigawatt hours of production capacity every year for the next decade.

“What the government did was a good thing for China,” said Mr. Jiang, the former CATL project manager. “Without its restrictions, I don’t think CATL would ever have been successful.”

Record Slump in China’s Auto Market Continues in September

The large boom of China’s automobile market has likely neared a top in this cycle. This chart is revealing:

The automobile industry is still critical to the health of an economy given its position in the supply chain. Automakers have a long supply chain to source parts and materials, ranging from value-added parts such as engines and electronic chips to raw materials such as steel, aluminum, and chemicals. The sector is a large employer, not only for manufacturing cars themselves, but also in sales, delivery, after-market repair, and maintenance.

Other sectors that are directly or indirectly involved in the automobile industry: financing and leasing of new and used cars, technology platforms for car sales (e.g. Autohome, Bitauto), insurance, trucking (delivery of new and used cars), downstream oil & gas (i.e. gas stations), etc etc.

Nevertheless, the Chinese automobile market is still considered under-penetrated. China has 179 motor vehicles per capita – USA has 838, Canada has 685, and UK has 471.

There will be bumps along the way – we are in midst of one of them – but I’m highly confident that, in the long-term, we will see greater automobile adoption.

Who Willed the Electric Car? China, and Here’s Why

The energy markets also have a significant influence in the automobile market:

China produces less than 5% of the world’s oil—used in combustion engines—but about 45% of the globe’s coal, used in electricity production for EVs. In much the way that the U.S. is the world’s largest user of homegrown crops for motor fuel despite widespread criticism of ethanol subsidies as costly and environmentally damaging, China will spend money and endure a dirty industry to be energy independent as well.

More than that, though, Beijing wants to dominate tomorrow’s car industry. China’s opening to the West came too late for it to be a major exporter of internal combustion engine vehicles, but it has made aggressive moves to dominate battery production, including securing sources of key metals. Through lavish subsidies it already has by far the world’s largest domestic EV market.

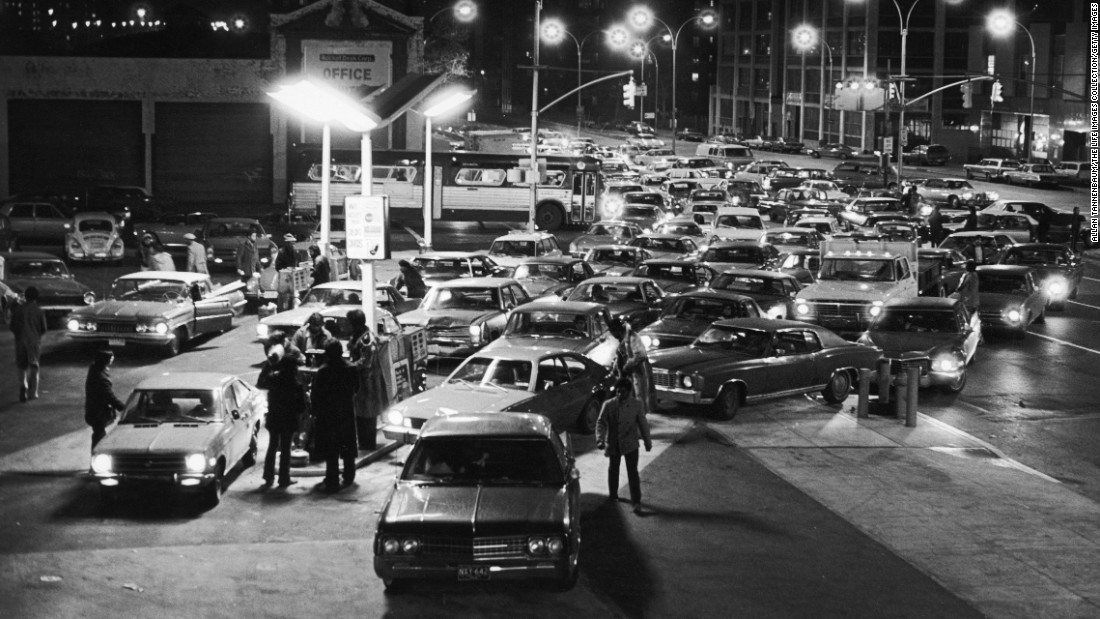
From reading a swath of energy-related books and being more involved with the industry over the last year, I’ve become more cognizant of the importance of energy independence to a nation’s stability. The Arab oil embargo is a typical example of this:

By the end of the embargo in March 1974, the price of oil had risen nearly 400%, from US$3 per barrel to nearly $12 globally; US prices were significantly higher.

This is largely why China is investing so heavily in electrical vehicles, renewable energy, and battery storage. It’s also why some developed nations still rely on coal for power (e.g. Poland). For another example of the importance of energy independence seeping into sectors…

South Korea targets hydrogen economy, from cars to cities

The country will accelerate its efforts to produce hydrogen fuel cell vehicles, or FCVs, and establish the infrastructure to support them, such as hydrogen fueling stations. It will also use hydrogen as an energy source to complement oil and natural gas.

South Korean companies, led by Hyundai Motor, have also started moving toward achieving a society powered by hydrogen. The country aims to be the first to popularize the new energy source.

Moon has expressed his willingness to proceed with the push toward a hydrogen economy, calling it a “revolutionary change” in the industrial structure as it can turn traditional energy sources such as coal and oil into hydrogen.

South Korea has almost no natural fossil fuel resources – it is a huge importer of thermal coal, coking coal, and oil. This is also true for Japan. Is it any wonder that those two countries are pushing for a hydrogen economy?

China enjoys bumper demand for euro-denominated bonds

Speaking of independence…

The Ministry of Finance was expected to follow up the launch with further deals, as often as once a year, according to one banker involved in the deal.

Beijing is seeking to encourage diversification away from dollar-denominated bonds, both in terms of its own debt and for corporate China, according to analysts.

Recently, I’ve been reading a lot about the US Dollar’s dominance in finance and trade settlements – it’s “exorbitant privilege”. It is quite clear that many nations are arguing for a shift away from this dollar-dominated system. To me, the light bulb went off when Mark Carney called for a shift from the current monetary system:

Mark Carney, the Bank of England governor, has said that the world’s reliance on the US dollar “won’t hold” and needs to be replaced by a new international monetary and financial system based on many more global currencies.

In a speech at the annual Jackson Hole gathering of central bankers in the US, he called for the IMF to take charge of a new system of currencies, insuring emerging economies from destructive capital outflows in dollars and removing their need to hoard US currency. In the longer term the IMF could “chang[e] the game” by building a multipolar system, he said.

It will take some time, but it seems like we are moving from a unipolar to multipolar currency system. That might alleviate the massive stress point on the current regime of relying solely on US dollar, but it may also add unwanted/unforeseen pressure points in other parts of the global FX system. We may also see some massive dislocations as we move from a unipolar to multipolar system.

China Embraces Bankruptcy, U.S.-Style, to Cushion a Slowing Economy

Now this is new:

China’s system differs significantly in at least one respect: Bankruptcy courts here sometimes are inclined to protect shareholders over debtholders—with the aim of averting social unrest.

Last year more than a thousand people, including judges, bankers, home buyers and employees packed into a university auditorium here in China’s northwest to hear how a court-appointed law firm would sort through more than 7.5 billion yuan ($1.07 billion) in claims against a failed real-estate company. Hundreds of police officers and security personnel stood watch because of fears that grievances would turn to violence.

In some cases involving publicly listed companies, courts give priority to small investors who have suffered losses to keep them from stirring social unrest, at the expense of debtholders and other creditors that rank higher in repayment priority, said Xu Defeng, a law professor at Peking University.

On balance, I think China is harming itself with this type of system instead of a more market-driven approach embraced by the US and Canada.

One of the bankruptcy process’ aim is the remove the debt overhang issue. Debt overhang usually occurs when a company is so underwater that even the most senior creditors would see only partial recovery on their claims in liquidation. However, most companies typically have a higher value as a going-concern instead of being liquidated. But senior debtholders may balk at putting forth more capital when their initial claim is already underwater. And junior stakeholders, such as equity holders, will be unwilling to inject capital, as any capital they inject will go straight into the debt holder’s pockets. The bankruptcy process solves this issue, but nevertheless, equity holders are usually wiped out (as they should be!).

If this distortion in China’s bankruptcy system is not corrected, it will most likely harm capital formation in the long-term. Debt has a asymmetric payout: limited upside, unlimited downside. That’s an unattractive payout profile! Creditors usually demand some protection, such as a first claim to assets in liquidation, in order to be comfortable lending. If that protection is removed, the cost of debt will likely go higher.

On the other hand, shareholders also conventionally have an asymmetric payout: limited downside, unlimited upside. The current bankruptcy system provides shareholders with an even more limited downside. While the cost of equity may lower, it will likely not be able to offset the increase in the cost of debt. Although who knows…

I’m probably making a bigger deal out of this than is warranted. It seems like favoring shareholders were limited to a few select cases. Nevertheless, will be an interesting development to watch..

Exclusive: ASML chip tool delivery to China delayed amid US ire

The semi-conductor industry in China is another one I will keep a closer eye on. For now, just a snippet:

China’s biggest maker of computer chips, Semiconductor Manufacturing International Corp., placed the order with ASML in April last year for its cutting-edge machine, which is needed to produce the latest, most powerful chips. But that shipment is now “pending later notice,” three people close to the situation said.

ASML also made clear that its near-unique EUV machine is subject to the so-called Wassenaar Arrangement — a multinational export control protocol designed to stop the spread of advanced technologies that can be used for military ends — but that it had an exemption from the Dutch and European authorities to sell the machine to Chinese customers. The permit appears to have now expired.

Permits take eight weeks to approve or reject, according to Dutch regulations.

Other Readings

DSV’s 2018 Annual Report

Grubhub Q3 2019 Shareholder Letter

Americold Equity Research & Investor Reports

Equinix Equity Research & Investor Reports

Autohome Q3 2019 Earnings

Books

Exorbitant Privilege

Other Media

Gold: The “Third Rail” of Capital Allocation

Long Shorts – Finding Asymmetric Upside

  • The thing is, most people instinctively want to short. That’s just the natural reaction. The problem is with government intervention, extreme fiscal and monetary intervention, shorting probably isn’t the way to do it. I’m short – it’s not really working.
  • Note: from my discussions with hedge fund folks in Canada, this is a consistent theme I’m hearing – shorting is simply not working.
  • Another one of my long/short themes is for profit education, because what we saw last cycle as well is that when people lose their jobs, the first thing they do is go back to school. They try to improve their careers and their education and make themselves more hirable. There was a huge boom and demand for for-profit schools the last cycle, I think that’s going to repeat this cycle. Additionally, there’s been a huge winnowing out as unemployment at historic lows.
  • Names mentioned: UTI, ASPU
  • When I look at shipping, I see a sector that’s at a major inflection point. If you go back to what I talked about previously, with trade wars and tariffs and global disruption, shipping is really a way to play geopolitical instability, and the easiest way you can think about it. Basically, a cargo goes from one place to another place, you have set trade routes that are historic and repeatable. Then suddenly, someone changes those routes, a politician, and instead of going to the most efficient way to move cargoes, you go somewhere less efficient.
  • We’re entering this period of geopolitical instability at a time when this historic lows in terms of total supply of new tonnage coming, it’s been a 10-year bear market. Anyone who’s bought a vessel for the last 10 years lost money, and so they stopped ordering finally.
  • Names mentioned: Scorpio
  • We’re seeing this in all the other sectors where one of the Ponzi sector stalwarts is going to fail and someone in the old economy that’s been struggling for many years against them is going to prosper.
  • I think rather than trying to guess when one of these Ponzi frauds dies, you should look at who the competition is and figure out who’s going to win when the uneconomic competitor disappears.

Inflation Risk Amid a Scramble for Yield

Thoughts

  • Are we in a duration bubble? Growth going up, quality going up, real estate, defensives, 100-year bonds, perpetual bonds, etc.

Notes and Commentary: BP Statistical Review of World Energy 2019

I have spent the past few days reviewing the data in BP’s Statistical Review of World Energy. The commentary in the PDF is quite interesting – it points out several key trends that the group is seeing in the world’s energy markets – and the dataset provided is rich as well.

Below are a couple of my notes and commentary on the review.

Coal

Coal continues to play a significant role in power generation – much to the chagrin of environmentalists. An astounding fact: the share of both non-fossil fuels and coal in 2018 remain unchanged from their levels 20 years ago (36% and 38%, respectively). A shift to electrification results in lower carbon emissions only if the sources of power generation also moves in the right direction (i.e. decarbonizing power).

Coal consumption also grew 1.4% in 2018, double its 10-year average. The spike in growth seems to have come primarily from India, Africa, and Central Asia.

But this surge in consumption was more than compensated for by a 4.3% growth in coal production, over 3x the 10-year average. China, India, Russia, and the US all contributed (the first three grew production, and the US’s production decline was slower than historic average).

Coal is interesting in that many countries rely on it as a source of energy independence. It also forms the foundation of power generation. However, there has been an increasing pivot to…

Natural Gas

Both global consumption and production of natural gas increased by over 5% in 2018.

A couple of interesting charts below…

The US is the world’s largest producer and consumer of natural gas. Sharp uptick post-2014 illustrates the impact of shale oil.

The US has largely substituted its coal consumption with natural gas, particularly since the development of shale oil, which has dramatically lowered natural gas prices compared to prices in other regions:

North American gas prices are over twice as cheap as European prices

Who is going to fill in the gap of Chinese natural gas demand?

The answer lies partly in Russia – which chronically produces more than it consumes.

It’s no surprise that China and Russia have begun to collaborate more closely on pipelines:

China-Russia gas pipeline construction begins new phase

Putin backs trans-Mongolian pipeline: Russian leader challenges Gazprom reluctance to accept China’s preferred route for proposed new gas pipeline

Lastly, something that surprised me:

Iran’s market share of natural gas consumption is c.6% in 2018.

Oil

Two things stand out here:

  • The dramatic uptick in South & Central America is largely due to Venezuela. Nevertheless, this region only accounts for c.7% of total global oil production
  • More dramatic is the Middle East’s declining R/P ratio. It’s no wonder these economies are looking to diversify their economies through SWFs (e.g. QIA, PIF).
  • What happened to North America in 1999? A massive increase in proved reserves in Canada.

Finally, two charts I created that I think will shape geopolitics for the next 5-10 years:

Asia Pacific is facing a growing deficit of oil…

…Sparked by China and India’s growth.

1. Assumed Japan and South Korea’s oil production was nil

Watchlist

Someone gave me an incredibly valuable advice for a watchlist.

Most people have a watchlist of their current holdings, or new names hitting 52-week lows, or whatever.

He suggested I create a stock list of high-quality companies. They may one day become cheap, and I can capitalize easily.

So my current list (work-in-progress) goes something like:

  • Chacha Foods – Manufacturer of roasted seeds. Incredible brand value in China and, perhaps more importantly, outside of Mainland China. The Taiwanese love it. It is one of the most recognizable consumer products brand out of China (amongst the likes of Tsingdao beer and Moutai baijiu)
  • Autohome – Similar business model to Auto Trader and Carsales. Online classified business for auto vertical that generates high free cash flows.
  • Americold – Cold-chain REIT, customer captivity.
  • IAC – I view it almost like the Liberty Group of internet companies.
  • Costco – Business model ensures low prices and incremental membership is pure profit.
  • Sleep Country – I posted an investment write-up of this.
  • Goldman Sachs – Customer captivity in advisory.
  • Constellation Software – Combine attractive business model with astute capital allocation.
  • TBD…

Investment Report: Long Sleep Country (TSX: ZZZ)

Recommendation

I recommend a long position on Sleep Country Canada (“Sleep Country” or the “Company”) with a price target of $30, offering 32% upside from today’s price. Investor sentiment has been held back due to a string of weaker-than-expected same store sales. However, a closer look suggests that the recent weakness is largely attributable to macroeconomic instead of structural factors. In fact, the Company has capitalized on disruption within the industry to strengthen its competitive advantages. While shorter-term investors worry about the effect an economic downturn may have, all signs show that the Company will continue to produce strong returns on invested capital through the cycle. The above factors have created the opportunity to buy a capital-light business with a long growth runway and a strong moat at an attractive valuation.

Market and Company Overview

Bloomberg suggests that specialty mattress retailers operate under the Consumer Discretionary sector in Home Furnishings. However, mattress sales exhibit different characteristics to typical furniture products. The North American mattress industry has demonstrated steady fundamentals underpinned by population and unit price growth. Since 1974, US mattress and foundation wholesale dollar sales grew by a 5.4% CAGR1. In Canada, mattress wholesale gross dollar sales have grown by 2.9% CAGR from 2004 to 2017, but this has been driven primarily by pricing increases1. Nevertheless, despite weakness in unit sales over the last couple of years, because mattresses are a necessity, purchases are typically deferred and not lost. Recent below-trend unit sales and a shortening replacement cycle for mattresses2 suggest pent-up demand and solid long-term growth prospects for the industry going forward. Industry sales forecasts for the next five year are generally accepted to be around 6% to 7% CAGR3.

Still, retailers are facing a lot of disruption. Many are closing stores, laying off employees, and facing financial trouble. In the past two years, prominent specialty mattress retailers, such as Mattress Firm and Innovative Mattress Solutions, have entered bankruptcy proceedings. In Canada, Sleep Country’s primary competitors have also largely retreated. Sears Canada, which held a 15% estimated market share of Canadian mattress sales in 2014, declared bankruptcy and closed all its stores. Hudson’s Bay has also elected to close all its Home Outfitters stores this year, BMTC Group is letting the leases on their Sleep Gallery stores expire, and Bed Bath & Beyond is rationalizing their footprint across North America.

In contrast, Sleep Country is capitalizing on this upheaval and growing. Since 2015, it has launched 60 new stores while only closing 1, growing its market share from 22% to 31%. Today, it is the only specialty sleep retailer in Canada with a national footprint and operates 271 stores and 17 distribution centers.

Investment Thesis

1. Attractive Unit Economics Protected By A Formidable Moat The unit economics of a new Sleep Country store is incredibly attractive, particularly in or adjacent to established regions with existing distribution infrastructure (termed “in-fill” and “satellite” stores, respectively). Because there are substantial regional fixed costs in mattress retailing that are independent of the number of stores in a particular region, new stores can leverage Sleep Country’s existing investments in advertising, management, and distribution to ramp up sales quickly.

Moreover, these new stores have minimal capital requirements. The Company’s mattress sales operate with a negative working capital model – customers pay up-front, but the company has between 30 to 45 days to repay suppliers. There is also little inventory risk as the Company typically orders mattresses after the sale is booked. Finally, low capital expenditures are needed to sustain the earnings power of each store. Because of all these traits, I estimate that a new in-fill store can realize an unlevered IRR of almost 20% on conservative assumptions.


Assumptions: First year sales estimate at low-end of company guidance, 4-wall gross margin at company guidance, staffing inflation costs at an annual rate of 2%, first year lease expenses estimated at Company average lease expense per store in FY2018, maintenance costs at 1.5% of annual sales, working capital requirements for accessories at 2.5% of next year sales, and buildout costs per company guidance.

These traits form a virtuous cycle that continue to widen the Company’s moat. As Sleep Country leverages its pre-existing network of stores and distribution centers to launch new stores, the additional revenues allows the Company to amortize fixed expenses over a larger base. Higher volumes also improves bargaining power over suppliers. The resulting improved margins and increased cash flows can be reinvested into new stores, bolstering the moat. New entrants simply cannot match the advertising spend, distribution network, or inventory costs that Sleep Country operates with.

This regional market share strategy has largely remained unchanged and resulted in strong returns. From 2014 to 2018, the Company achieved a Return on Incremental Invested Capital (ROIIC) of nearly 25% CAGR.

2. Supplier Captivity – OEMs are Reliant on Sleep Country’s Retail and Distribution

Online DTC companies have grown at an accelerated pace and taken market share from traditional retailers. At first glance, their business model of eliminating the wholesale distribution channel from the supply chain threatens to diminish Sleep Country’s competitive positioning.

However, while this model looks good on paper, mattress OEMs have historically relied on the wholesale channel for a reason: OEMs need scale to profitably churn out mattresses. For instance, Tempur-Sealy, the largest North American mattress OEM, relied on the wholesale channel for over 90% of its sales in 2018. Even formerly online-only DTC upstarts have realized the limits of the direct channel and are expanding into wholesale: Casper has announced a partnership with Target to sell their products in Target stores, Tuft & Needle products can now be found in Walmart, and Leesa partnered with Williams-Sonoma for its retail network. Specialty mattress retailers are particularly important within the wholesale channel given their rise: from 1993 to 2017, specialty retailers have grown their market share of bedding sales from 19% to 54%4. Better customer service, wider product selection, and the big-ticket nature of mattress purchases have all contributed to this growth. This channel is so important that Tempur-Sealy bought Innovation Mattress Solutions out of bankruptcy to protect its distribution network and re-entered into a supply agreement with Mattress Firm – the largest specialty mattress retailer in the US – despite prior bitter legal disputes.

But my [strategy] is – generally we like to use third-party retailers. Return on invested capital is fantastic, and if you have a supportive third-party retailer, that is who we want to do business with.

Scott Thompson, CEO of Tempur-Sealy
June 12, 2019 (emphasis added)

We expect as we continue to roll out  more and more wholesale business that that’s going to drive profitability. […] As we look at the short term for DTC, it’s going to be tough to be driving high profit,  and the wholesale channel is what is going to enable us to do that.

Mark Watkins, CFO of Purple Innovation
Q1 2018 Earnings Call(emphasis added)

For OEMs looking to gain and hold a meaningful share in the Canadian market, they have no choice but to negotiate with Sleep Country. With a 31% market share in Canadian mattress sales and a national footprint, Sleep Country’s retail network is vital. As a result, the Company can extract concessions from suppliers, such as better pricing, volume rebates and “just-in-time” inventory arrangements.

Bears may argue a continued growth of the online channel will allow OEMs to sell direct more easily and lead to an erosion of Sleep Country’s competitive positioning. However, because of the tactile nature of the mattress purchase decision, brick-and-mortar will likely continue to dominate as a distribution channel. Industry trade group The Better Sleep Council found that 85% of consumers still primarily rely on brick-and-mortar stores for new mattress purchases. Moreover, Sleep Country has also invested in their own e-commerce efforts, offering an omni-channel network that is hard for OEMs to match.

3. Multiple Levers for Growth

Sleep Country has demonstrated a strong track record of thoughtfully opening new stores across the country. Since 1994, the Company has opened an average of 11 stores a year and continues to aim for 8 to 12 new stores a year. Management tracks store density, measured as store per population, to measure market saturation. Since IPO, density has grown from one store per 162,000 to one store per 134,000. The Company believes that a store density of one store per 100,000 in population is achievable without oversaturating the market. For context, US mattress retailer Mattress Firm had an average density of one store per 90,000 in 2016 (one store per 50,000 in its most dense markets), and European mattress retailer Beter Beds has an average density of one store per 115,000 in its mature markets.

Assuming a conservative annual population growth of 1.4%, the rate at which Canada’s population grew last year, this suggests that Sleep Country can continue to add 290 new stores for the next 40 years at an average rate of 7 new stores per year. Even assuming no population growth, the Company can open 10 new stores per year for 10 years without oversaturating the market.

Sale of bedding accessories is another key lever for growth. Revenues from accessories have grown by 16% CAGR from 2012 to 2018 and typically carry a 10% higher margin compared to the margins on mattress sets. The continued push into accessories not only allow stores to upsell higher-margin products with mattresses, it also enables higher traffic and conversion rates – the Company has estimated that customers are 75% more likely to buy from Sleep Country after having purchased an item.

Valuation

I arrived at my valuation target of $30 primarily by probability-weighting a combination of DCF scenarios, but also looked at multiples on comparable companies and precedent transactions to benchmark valuations. In my base case, Sleep Country adds 68 new stores and grows sales per store by 1% CAGR, resulting in a 3.6% 8Y revenue CAGR. I believe this is a conservative forecast compared to the industry’s forecasted growth of 6% to 7% over the next five years. EBITDA margins normalize after an elevated period of advertising spend and FCF conversion averages 40% throughout the forecast period.

I also contemplated a “Harvest Case”, in which the Company does not open any new stores and focuses solely on operational execution. 8Y revenue CAGR is lower at 2.1% and margins are 500bps lower versus the base case. The added conservatism still provides an upside of almost 18% to today’s price, implying a margin of safety. Comparable companies also suggest the stock is trading at cheap valuations. Sleep Country is rated meaningfully below peers on multiples of EBITDA, earnings, and free cash flow despite higher margins. A re-rating to median multiples suggest a 20% to 70% upside. Precedent transactions also confirm upside potential. Even in the throes of the Great Financial Crisis, financial sponsors were willing to take Sleep Country private at 9x EBITDA. Since then, similar retailers have transacted at multiples averaging between 9x and 10x. Sleep Country’s closest comparable, Mattress Firm, was taken private at 10.5x NTM EBITDA. Applied to consensus estimates for the Company’s EBITDA, that multiple suggests a 75% upside.

Key Risks

1. A growth in sale of accessories increases working capital requirements. A higher number of SKUs will likely also increase distribution costs and shrinkage rates. However, the upside potential from sales growth and margin accretion more than offset these risks.

2. Greater-than-expected adoption of online delivery may reduce the Company’s competitive positioning, but investments in building an omni-channel platform mitigate this risk.

Appendix

Sleep Country Financial Forecasts and DCF Valuation

Notes:  Capitalized operating lease expenses excluded from capitalization table in DCF valuation as it is explicitly forecasted by rollover / maintenance lease commitments and new lease commitments
1  Reflects EBITDA adjusted for lease expenses by applying an income statement charge on previously disclosed lease expenses. Of the income statement charges, approximately 68% was allocated to D&A in Cost of Goods Sold, 8% to D&A in G&A expenses, and 25% to interest expense on lease liabilities

Comparable Companies Analysis

Source:  FactSet
Note:  Forward multiples on broker consensus estimates

Precedent Transactions of Specialty Retailers

Source:  FactSet, Bloomberg, Company filings
Note:  Multiples are on NTM financials if available; otherwise, on LTM or publicly-disclosed financials

Endnotes

  1. International Sleep Products Association, Company filings
  2. Industry trade group The Better Sleep Council found that consumers are replacing their mattresses every 8.9 years in 2016 versus 10.3 years in 2007
  3. Source: Zion Market Research, Bed Mattress Industry
  4. Source: Furniture Today, Company filings

Short Report: Westshore Terminals Investment Corporation (TSX: WTE)

Recommendation

I recommend shorting shares of Westshore Terminals Investment Corporation (“Westshore”) with a price target of $14, over 30% below today’s price of $20. The company’s high operating leverage is unequipped to tackle the unprecedented competition from nearby terminals and Westshore will have to reduce loading rates to maintain throughput or risk losing volumes. It has historically relied on one customer for nearly 60% of its throughput and every indication is that the customer is going to cut its reliance on Westshore. Challenging industry trends in the U.S. thermal coal sector further bolster the thesis. Scenario analysis suggests that the risks skew heavily to the downside and there is a material risk of a permanent loss of capital. Although the primary valuation technique was discounting future cash flows, even applying today’s 8x multiple to the base case EBITDA run-rate post-Teck renegotiations suggests a downside of over 70%.

Business Description

Westshore operates a coal storage and loading terminal in Roberts Bank, B.C. The facility was officially opened in 1970 with a throughput capacity of 5.5 million tonnes (mt), but capital investment programs since then have increased its capacity to 33mt per annum (mtpa) today. Westshore shipped a little over 30mt of coal in 2018. The company receives handling charges from its customers on a throughput basis – getting paid a fixed fee per tonne loaded – and does not take title to the coal it loads. 

Westshore has historically enjoyed several competitive advantages. It is the largest coal loading facility on the North American west coast. Three major railways service the terminal: Canadian Pacific, CN Rail, and BNSF. Of the three B.C.-based coal terminals (the other two being Neptune and Ridley), it has the highest deep-water berth and coal storage capacity. Finally, because its assets have a long-life and require only marginal maintenance capex, the business is capital-light.

Figure 1. Comparison of West Coast Coal Terminals

The combination of its advantages has resulted in a business with fantastic returns. Shareholders have enjoyed an 11.6% annualized total shareholder return over the last ten years. It also offered a high average shareholder yield[1] of 5.7% during that period.

But the business is not without a few blemishes. It has historically suffered from material customer concentration risks. Teck Resources (TSX: TECK.B, NYSE: TECK) has accounted for an average of 61% of coal throughput over the last eight years; the top three customers accounted for an average of 91%. Westshore also handles a significant amount of thermal coal (42% of total throughput in 2018), which is arguably less desirable than met coal because North American thermal coal exports are inherently less competitive in the seaborne markets and can quickly become uneconomic to export.

The market has largely shrugged off these concerns. The forward EV/EBITDA multiple and P/E ratio for Westshore has averaged 12.2x and 19.5x, respectively, over the last ten years. Currently, Westshore is trading at a forward EBITDA multiple of 8.0x and P/E multiple of 11.2x[2].

Institutional investors currently make up 25% of the shareholder base, the largest being Burgundy Asset Management’s ownership with a 13% stake. James Pattison and other insiders also owns about 34% of shares, resulting in a free float of roughly 36 million shares, or roughly 53% of total shares outstanding. Short interest is at 1.8% of total shares outstanding and 3.4% on the free float[3].

Thesis

Despite a track record of delivering strong shareholder returns, I believe that Westshore presents a compelling short opportunity today. Even though the market is aware of the risk that an upcoming contract renegotiation with Teck poses to future earnings, it otherwise believes that it is “business as usual”. Sell-side analysts are assuming a long-term throughput of 30-33mtpa and a consistent 2% pricing growth. Instead, I believe that Teck’s actions are a symptom of an underlying industry shift. Westshore’s historically high returns have invited competition that will erode its profitability going forward. Furthermore, the company’s operating leverage makes it fragile and inflexible. All of this results in a stock that has a meaningful risk of a permanent loss of capital with limited upside.

1) The market does not fully appreciate the erosion of Westshore’s moat

Many factors suggest that Westshore’s competitive advantage as the premiere west coast coal loading facility is quickly eroding. Competition from nearby terminals, Neptune and Ridley, is ramping up. Whereas Westshore accounted for nearly 60% of total west coast coal capacity in 2012, its share today stands at 54%.  An inflection point will occur by 2021 when Westshore is projected to account for less than half of total capacity. Teck and Canpotex, the owners of the rival Neptune Terminal, have already embarked on a C$470 million capital investment program to expand capacity by almost 50% to 18.5mtpa; the expansion project has been permitted since October 2018. Meanwhile, AMCI and Riverstone Holdings, private equity specialists in natural resources, acquired a 90% stake in the competing Ridley Terminals from the Canadian federal government in July 2019. There is a strong likelihood that the new owners push for greater utilization via lower rates – Ridley operated at only 57% of total capacity with an average loading rate even higher than that of Westshore’s. Ridley has also previously announced plans to grow capacity by 4mt, from 16mtpa to 20mtpa, and even another possible expansion to 28mtpa.

Figure 2. Location and Capacity of Competing West Coast Coal Terminals

Source: Company filings, Teck Resources Investor Presentation, proprietary estimates

In contrast to the growing supply of export capacity, thermal coal producers are struggling to stay profitable, cutting production, and consolidating. Since peaking at 715mt in 2010, total U.S. and Canadian thermal coal production has contracted at an average annual rate of 3.7% to 526mt in 2018[4]. Westshore’s thermal coal producing customers, located in the Powder River Basin (PRB), are hit particularly hard. This is because coal for the PRB has a lower average heat quality versus the coal from other North America basins[5]. When sending coal over long distances, the heat quality needs to be high enough to justify the transport costs. Therefore, U.S. thermal coal producers are considered swing suppliers in the seaborne coal markets – selling into the market when other suppliers cannot meet demand – due to their distance from end customers in Asia versus producers in Indonesia and Australia. Consequently, their exports can become uneconomical in just slightly challenging pricing environments.

The current situation with Westshore’s second largest customer, Cloud Peak, provides good insight into this precarious dynamic. In the first quarter of 2019, Cloud Peak realized an average of ~US$53/t for the coal it exported through Westshore at an average cost of ~US$56/t. In other words, Cloud Peak is making a loss on each tonne of coal exported. It only realized gross margins of 8% on its coal exports in 2018. Indeed, Cloud Peak filed for Chapter 11 this May, and is likely to use it as an opportunity to renegotiate its existing transport agreements with Westshore and BNSF. Otherwise, Cloud Peak cannot afford to continue to export. This is not unprecedented – Cloud Peak temporarily halted coal shipments to Westshore altogether in 2015 when prices were uneconomical[6].

More broadly, producers in the Powder River Basin are shrinking and consolidating. Recently, Peabody Energy and Arch Coal have agreed to combine their PRB operations; the entity will control roughly two-thirds of coal in the basin. A spate of bankruptcies in the basin over the last year, including those of Westmoreland Coal, Cloud Peak Energy, and Blackjewel, further highlight the trend.

The shifting industry dynamic will significantly weaken Westshore’s future earnings power. First, growing capacity limits the bargaining power Westshore traditionally held over producers looking to export coal to Asia. Secondly, Westshore’s pricing power is also hindered by the thin margins producers are receiving for their exports. Current bankruptcies and closures also jeopardize Westshore’s base of thermal coal producing customers. Additionally, a more consolidated base of U.S. coal producers will yield greater negotiating leverage. To sum up, as the supply curve shifts right and demand curve shifts left, prices will invariably scale down.

Finally, even though Westshore does not directly take title to the coal it handles, it is still indirectly exposed to seaborne coal pricing volatility through its customers’ shipments. Given the volatility of thermal coal exports, this revenue stream is lower quality than that of met coal exports. And, as I will soon illustrate, thermal coal will likely grow from ~40% of total Westshore shipments to ~50%-60% by 2022, significantly diluting the quality of Westshore’s future earnings.

2) Teck has signaled a long-term strategic shift away from Westshore

Teck is currently contracted to ship 19mtpa through Westshore until March 2021, and every indication is that Teck plans to cut their reliance on Westshore for exports afterwards. Teck and Canpotex have already embarked on a large capital investment program to upgrade throughput capacity at their jointly-owned Neptune terminal to over 18.5mtpa. Teck’s management believes it can even get capacity to over 20mtpa. The expansion is scheduled for completion in the second half of 2020, around half a year before Teck’s contract with Westshore expires.

Teck has multiple reasons for expanding Neptune’s capacity. Management has been openly displeased at the service quality of Westshore Terminals, pointing to operational issues in which Teck’s high-quality met coal has been contaminated with lower-quality thermal coal from U.S. producers. Teck’s management also believes that Westshore has periodically prioritized lower margin thermal coal shipments over Teck’s high margin met coal shipments. Finally, dumper outages have negatively affected ability to timely export coal. Due to the volatility of seaborne met coal prices, the opportunity costs here is significant. Neptune presents Teck the chance to lower transportation costs, control the supply chain, and maximize shipments during surge prices.

Figure 3. Teck Management Commentary on Westshore and Neptune

On the advantages of exporting through Neptune

One is the absolute reduction in cost per tonne, forever, for the limited cost compared to what we had at Westshore, and second, the consistency of ability to deliver when prices are high, where we won’t be cut off by thermal coal buyout from the U.S. So these two things in themselves are worth like hundreds and hundreds of millions of dollars to us.

Don Lindsay, CEO of Teck Resources, 3-Apr-2019 (emphasis added)

On operating issues at Westshore and the imperative to move to Neptune

It’s quite frustrating and costly to us to suffer bad service and not be able to get metallurgical coal onto a boat which has very large margins because Westshore is, we feel at times, prioritizing U.S. Powder River Basin thermal coal with margins of, in many cases, a few dollars a tonne. It is difficult for us, I think, to let that situation perpetuate any longer than we have to. As Ron says, we have a contract until March 2021, but after that the switch to using Neptune as our number one port, and maybe switching to using Westshore and Ridley more to handle the balance, should I think improve the reliability of our ability to get coal onto a boat in a timely fashion, particularly when prices are high, which is to some extent when we’ve seen [Westshore’s] service level drop.”

Andrew Golding, SVP Corporate Development at Teck Resource, 24-Jan-2019 (emphasis added)

Why pay a margin to someone else?

But the advantage of Neptune, obviously is, we own it, so it’s a cost of service facility. We’re not paying a profit margin to another supplier or transportation provider. And it gives us the flexibility to move the coal when we can take advantage of various price moves or different customers.

Ronald Millos, CFO of Teck Resources, 28-Nov-2018 (emphasis added)

Bulls may argue that Teck has long relied on Westshore for coal exports and the current posturing is merely a negotiating tactic in advance of contract renegotiations. This argument is plausible but unlikely. Instead, the more likely explanation is that Teck did not have an imperative to control its coal export supply chain until demand for seaborne coal broke out in 2007. When Teck acquired its 46% interest in Neptune in January 2003, it only had 8mtpa of capacity, and all three west coast ports had significant unused capacity[7]. The growth of Asian demand for coal post-2007 changed this dynamic, and previously underutilized terminals reached almost full capacity. Neptune was underinvested and Teck had no choice but to rely on Westshore for shipments, resulting in a 10-year take-or-pay contract that has been highly lucrative for Westshore. Since then, realizing the strategic advantages that Neptune poses, Teck has been working to improve Neptune’s capacity and efficiency. In 2009, Neptune could only fulfill roughly 40% of Teck’s met coal production. Today, Neptune can do nearly 50%. By 2021, almost 70% of Teck’s coal production can be exported through Neptune. 

There are a few hurdles in Teck’s plan to ramp up capacity at Neptune. The first is rail access: the bridge entering the Neptune terminals must occasionally be lifted to allow container ships to pass through, constraining rail capacity. However, CN is taking advantage of a government spending initiative to expand access into the area to Neptune terminals and estimates this could increase train frequency by as much as 50%. Furthermore, CP’s Senior Vice President has acknowledged Teck’s plan to expand Neptune and did not hint at any potential rail issues, instead stating that it is “good business for Teck, and that it gives them a higher degree of diversification in terms of outlets, but frankly, it’s not bad business for us either.” Another potential challenge is smoothly ramping up loading volumes at Neptune. Neptune’s annual record for coal throughput was 7.6mt in 2017 and ramping this up to 18mtpa+ without operational disturbances is a significant although not insurmountable challenge.

Nevertheless, it is clear that Teck fully intends to use Neptune as its primary port for the long-term. Why continue to send the bulk of your coal shipments to Westshore when you own 46% of a nearby port? Even if Westshore is able to renegotiate a favorable contract in the short-term, it will face steadily declining shipments from Teck as Neptune becomes more ramped up. As a result, Westshore will have to rely on thermal coal producers or new coal mines (a rare event) to replace the loss of Teck’s throughput.

3) Westshore has high operating leverage and is unequipped to respond to the shifting competitive landscape

Westshore runs a high fixed-cost structure. This operating leverage has historically been a boon to shareholders in good times – any increase in loading rates or coal shipments falls through to the bottom line. For instance, even though Westshore’s coal shipments contracted by 6% from 2014 to 2015, its EBITDA margins nevertheless grew by 4% because they were able to increase loading rates because they were able to increase loading rates from ~C$10/t to ~C$11/t.

But leverage can also magnify losses. A majority of Westshore’s leverage come from its work force. Salaries, wages, and benefits make up 72% of its operating expenses and over 90% the labor force is unionized. Other fixed expenses include depreciation, lease payments to the Vancouver Fraser Port Authority for the right to use the terminal, administrative and management payments to Westar (a subsidiary of the Jim Patterson Group), and director fees. In 2018, fixed expenses accounted for nearly 90% of total operational expenses[8].

The bulk of these expenses can be counted on to grow. Union agreements at a minimum generally keep wages tied to inflation and the fixed portion of Westar’s administrative and management fees have a built-in 3% escalator per annum. The head office is lean too with just six individuals handling management and administrative roles. At the minimum, Westshore will find it challenging to cut its expenses in line with projected throughput contraction.

Additionally, Westshore’s assets are inflexible. It is solely built for coal storage and loading. While it has the potential to ship other dry bulk commodities, the endeavor would involve significant capital investment and face heavy competition with nearby terminals and ports with similar capabilities, such as the Alliance Grain Terminal (grains), Pacific Coast Terminals (sulphur, bulk liquids), Neptune Terminals (coal, potash), Longview port (eight terminals), Grays Harbor port (four terminals), etc.

As a result, Westshore is fragile and unequipped to tackle the deterioration of its competitive position and volume loss of a major customer.

Valuation

My base case assumptions for Westshore include:

  • Post-March 2021, Teck renegotiates a 9mtpa take-or-pay contract with Westshore with a loading rate of C$10/t with a 3% annual escalator. Of the 27mt met coal production forecasted for 2021[9], Teck ships a total of 9mt through Westshore, 13mt through Neptune, 3mt through Ripley, and ships 1mt to the east coast.
  • Given Cloud Peak’s current economics (losing money on every tonne of coal shipped), Westshore has to choose between cutting rates or losing production volumes. I assume that coming out of bankruptcy, Cloud Peak renegotiates an 8mtpa take-or-pay contract with a loading rate of C$7/t with a 3% annual escalator. This is conservative – there is even a chance that Cloud Peak does not continue to produce coming out of bankruptcy.
  • Riversdale Resources’ Grassy Mountain mine, a met coal project that reserved 4.5mpta of capacity at Westshore until 2030, begins production in H2 2022 and achieves steady-state production rate of 4.5mtpa. Although management has guided production for Q1 2021, the project is still being permitted and construction is estimated to take 21 months afterwards. I expect the timeline for the project will likely be pushed out given the current public and regulatory scrutiny on coal’s environmental impact (Riversdale originally expected the mine to be open in late 2018).
  • Signal Peak and other customers’ shipments kept at 2018 levels, rates are escalated by 2% per annum.
  • Salaries, wages, and benefits remain fixed and there’s a two year lag time before Westshore is able to lower these expenses in response to throughput reduction.
  • Discount rate of 5.4%, backed out from the current risk-free rate, estimated equity risk premium, and benchmarking beta from comparable companies. This rate is arguably too conservative given the increased riskiness of Westshore’s business and lower quality of future earnings. Sell-side analysts have a discount rate ranging from 7.0% to 8.5%.

Figure 4. Summary Operating and Financial Figures

The above assumptions reflect the precarious positioning that Westshore is facing: eroding competitive advantage, volume loss of a major customer, and high operating leverage. EBITDA margins contract from its 2018 level of C$194 million to a run-rate of ~C$100 million in 2021. A DCF with these assumptions results in an estimated value per share of C$19, a 12% downside from today’s prices. However, I also looked at four other possible scenarios (Modest Winner, Blue Sky, Modest Loser, and Bear) and suggest that the risks skew heavily to the downside. More optimistic assumptions for Westshore’s future range in an implied value range of C$20 to C$28 per share, whereas more pessimistic ones range from 60% downside to a complete loss of capital.

Figure 5. Probability-Weighted Target Price Calculation (WACC: 5.4%)

A probability-weighted valuation suggests a target share price of $14, a 33% downside to today’s prices.

Using the discount rate that sell-side analysts suggest, 7.0%, suggests a nearly 50% downside to today’s prices.

Figure 6. Probability-Weighted Target Price Calculation (WACC: 7.0%)

Even applying today’s 8x multiple to the base case EBITDA run-rate post-Teck renegotiations suggests a downside of over 70%. And given that thermal coal’s share of total shipments is projected to grow to nearly 60%, it is reasonable to expect that Westshore’s multiples de-rate in future.

Key Risks

Coal prices: Seaborne coal prices are volatile, and there remains a risk that a spike in thermal coal prices results in better-than-expected performance at Westshore. Going long a basket of U.S. thermal coal producers to hedge some of the risk may be warranted. In the event that thermal coal prices spike, and there is more room for Westshore to negotiate higher rates, the long basket of thermal coal producers would offset the short position in Westshore.

New coal mines: New coal projects outside of Riversdale’s Grassy Mountain could come online to fill in the gap that Teck leaves post-March 2021, although the likelihood is low given the hurdles that new coal projects face, including scarcity of financing, increased regulatory scrutiny on environmental impacts of coal mining, and prolonged overcapacity of the sector.

Takeout risk: A financial buyer could find Westshore’s assets compelling given its low leverage and high cash flow generation and end up paying a premium to today’s prices to purchase the company. However, I believe this risk is sufficiently captured in the “Blue Sky” scenario.


[1] Shareholder yield is similar to dividend yield but accounts for share repurchases as well

[2] Source: FactSet; multiples on broker consensus figures

[3] Source: International Industry Regulatory Organization of Canada (IIROC), 18-Jul-2019

[4] Source: Wood Mackenzie

[5] Source: Wood Mackenzie, EIA

[6] As a result, Westshore had to cut their dividends and the stock de-rated to a 7.9x P/E multiple

[7] Source: British Columbia Ministry of Energy and Mines, 2004

[8] Only the fixed portion of lease payments and administrative and management payments to Westar are included; Westshore also pays participation and incentive fees to the VFPA and Westar

[9] Source: Broker consensus estimates

A Good Quote

“Although I personally felt that the financial model made no sense, so many famous investors piled in, and I figured that I can’t have a better understanding than the investors.”

Anonymous employee from Ofo

What a great quote about the dangers of following the consensus and not conducting independent analysis.

Quote first read from the following article: https://chinaecontalk.substack.com/p/chinaecontalk-ridesharing-ofo-flew

Book Review: Boom, Bust, Boom

Boom, Bust, Boom: A Story About Copper, the Metal that Runs the World

There is a saying in the mining world: “It used to be one poor man digs a hole and gets rich. Today a rich company digs a hole and goes broke.”

After ten months of working in investment banking mostly focused on metals and mining, I decided to finally pick up a book about the business of mining itself. Although I’ve previously read books on the history of natural resources (e.g. Daniel Yergin’s books on oil, Power of Gold), this was the first book that focused solely on mining.

Overall, it was a compelling read. Although I was expecting a more technical book on mining itself, particularly the technical and geological aspects, this book’s focus on the environmental and social impacts of mining was illuminating. Prior to reading this book, I was largely ignorant of the negative ramifications of mining.

The author did a good job presenting a balanced view of mining, which I think can be summed up as a necessary evil. Unfortunately, mining commodities such as copper, nickel, and zinc are necessary for our standards of living. The air-conditioner, the computer, railways – these things would not be as convenient or available without the presence of large scale mining.

It was also fascinating to read the author bring up mines that I’m familiar with, such as the Rosemont mine in Arizona. Recently, I worked on a private equity’s activism campaign to refresh the Board of Directors of Hudbay Minerals, which owns the Rosemont mine and is attempting to finalize permitting and begin construction.

The book’s focus on the Pebble mine, Resolution Copper mine, and Grasberg mine is also interesting. In addition to their unique social and political considerations, the scale and complexity of these mines are hard to fully comprehend.

The Grasberg mine in Indonesia, which will employ the block caving mining method for future production

The author finally concludes that in the battle of interests between the mining corporation and the local community, the corporation almost always win. Unfortunately, I concur. There is a common fixation of political leaders across all of human history – security of resources, at any cost.

I wonder if technology will ever solve some of the ills of the mining sector? Indeed, the mining method has been largely unchanged since humans first started mining – we pick up ore, crush it, and look for the precious commodity within. There was mention of promising new methods of extraction, such as Curis Resources’ in-situ mining method. But I have to imagine that someone will come up with a cleaner method for extraction in future. We can now grow meat in labs, FFS.

I came away from the book with a greater understanding, appreciation, and perhaps even apprehension, of the mining industry.

A Caterpillar 797F – look at those tires!

YY Inc. (NASDAQ: YY) – Long

Recommendation

I recommend buying shares of YY Inc. (“YY” or the “Company”) due to the Company’s established moat and long runway of growth. YY has proven its business model in YY Live, which averaged an operating margin of 32% and free cash flows of 15% over the last five years. The Company is now exporting that business model to larger and underpenetrated markets in e-sports and foreign markets. The recent pullback in YY’s shares, largely sparked by a sell-off in Chinese equities from ongoing US-China trade tensions, provide an attractive entry point for long-term investors looking to purchase a growing business occupying a compelling niche in social media at a discount to current value.

Business Description

YY was founded in 2005 as an online web portal but pivoted its business model to focus on live streaming in 2012. Since then, live streaming has been the core focus of the group, comprising about 94% of total net revenues in 2018. YY is now the number 1 Chinse live-streaming platform (ranked by monthly active users, or “MAU”) with three distinct business operations: i) YY Live, the Company’s legacy business focused on Chinese general entertainment livestreaming; ii) Huya, a spun-off entity that focuses solely on e-sports live streaming; and iii) Bigo, a recently acquired Singaporean-based startup focused on live streaming and short form videos in the Indian, ASEAN and MENA markets.

Live streaming platforms benefit from network effects seen in most social media apps. On one side of the platform lies content creators; on the other side, viewers. As a platform gains creators and viewers, the value proposition of the whole increases – a larger audience for the creators and more content choices for the viewers. 

In contrast to the subscription-based business model typically seen in North American video content platforms, such as Amazon’s Twitch, Alphabet’s Youtube, and Patreon, YY’s business model is focused around a tipping and gifting ecosystem. In return for the creators’ content and broadcast, they are compensated with tips, in the form of virtual gifts, by viewers. YY takes a significant cut for facilitating this transaction (typically ranging from 10% to 40%).

What the gifting model sacrifices in consistent and predictable revenue generation compared to the subscription model, it makes up for in compelling economics and aligned incentives. There is a strong social phenomenon at work behind each tip, in which viewers compete for the streamers’ attention by gifting higher value gifts. The competitive bidding nature of this model is highly profitable – according to different sources, a live streaming platform can be self-sustaining with only the top 4% of its users. Moreover, because creators receive immediate feedback from their viewers, they’re incentivized to broadcast higher quality content more frequently. As a result, the business model leads to a steady supply of content – something North American live streaming apps struggle with – and reinforces network effects.

Investment Thesis

1) Current dynamics of the three segments mask the compelling economics of YY’s businesses

A deeper dive in YY’s legacy business segment, YY Live, uncovers a business model with compelling network effects and economics. The medium stands out for its interactivity, social element, immediateness, and authenticity. The platform is sticky – users tend to stay on a live streaming platform even if their main creator leaves for another platform – and the Company has a proven ability to convert viewers into paying users. Moreover, because users load a wallet prior to spending on the platform, the business working capital is often a source of funds. All of this results in a business that boasts a revenue CAGR growth of 33% since FY2014 and a 5-year average operating margin of 32%.

Nonetheless, the Company recognizes that there are more attractive growth opportunities than YY Live. Instead of focusing on reinvestment in its legacy business, YY Live’s free cash flows are redirected to support growth in Huya and Bigo, segments with much more favorable growth backdrops. As a result, the profitability of the consolidated financials appears worse than reality, which I believe is a factor in the Company’s undervaluation.

2) Consolidation in the Chinese market will likely improve profitability

The market continues to view China’s live streaming market as hypercompetitive. Certainly, there were over 100 live streaming platforms in 2016. However, there are several signs that competitive pressures have eased significantly and the market is heading towards consolidation. After the China live streaming boom in 2016, several have gone bankrupt or have closed operations. The top four players in the Chinese talent live streaming market now holds 71% of industry market share.

Consolidation is evidenced in the Chinese e-sports live streaming space as well. According to interviews with YY’s founder, Tencent intends to consolidate the e-sports streaming industry through merging its investees to create a Chinese streaming powerhouse similar to Twitch (Tencent holds a 29.6% interest in Huya and a 40.1% stake in Douyu, a rival streaming platform). This is a well-known strategy for Tencent – it followed the same playbook in merging several domestic music groups to form Tencent Music, creating a profitable music streaming giant. The third largest e-sports streaming platform, PandaTV, declared bankruptcy in March 2019, adding further momentum to consolidation. Consolidation will likely beget greater pricing power both in terms of taking a greater cut of transactions within the gifting ecosystem as well as demanding higher fees from advertisers from a larger audience.

3) Attractive industry trends and long overseas runway underpin growth

The China e-sports market is the largest in the world behind the United States and the top two platforms (Huya and Douyu) generate almost 50% of e-sports revenue worldwide. Huya’s scale almost rivals Amazon’s Twitch – while Twitch’s platform boasted 140 million monthly unique viewers in 2018, Huya is catching up with 124 million active users in Q1 2019. And although Huya’s Average Revenue per Paying User (ARPPU) has doubled since 2015, it is still less than half of what YY Live earns on its Paying User. This is due to a combination of two factors: i) the proportionate number of paying users to active users on Huya  are half of that of YY Live’s, and ii) the Average Revenue per User (the more traditional “ARPU”) is approximately 60% lower than YY Live’s estimated ARPU. Nevertheless, both figures have improved significantly since 2017. Given the market trend to consolidation, there is a strong possibility that ARPPU of Huya will eventually overtake that of YY Live’s. All these factors combine for an attractive, long runway of growth.

Bigo may be even more attractive for growth, as it capitalizes on a first-mover advantage in the less competitive, overseas market. Bigo is already a top-grossing app. Based on App Annie’s top grossing ranks in Google Play, Bigo is among the top ten most profitable non-gaming applications in 39 nations / regions, including 19 in MENA, 8 in ASEAN, and 12 other countries including India, the United States, Australia, Canada, etc. To illustrate its popularity, it currently ranks above apps such as Dropbox, Headspace, and TikTok in the US. Growth in India has been particularly strong – the country captured 32% of Bigo’s 11 million new Android users between January and February of 2019, according to Sensor Tower. Although Bigo’s financials are not yet consolidated into public filings, the price paid for Bigo – 4.3x EV / trailing sales – seems reasonable to public comparables (MOMO, YY’s closest comp, trades at 4.3x EV / 2019 sales).

4) Strong management team with skin in the game

David Li, CEO and founder of YY, has a proven to be a strong strategic thinker and astute capital allocator. In addition to pioneering the Chinese live streaming market with YY Live, he achieved viral growth in Bigo’s apps, achieving 23 million monthly active users in its live streaming platform and 46 million monthly active users in its short form video platform since its March 2016 launch. Furthermore, Li’s incentives are aligned with shareholders – he has a ~15% stake in YY.

What the gifting model sacrifices in consistent and predictable revenue generation compared to the subscription model, it makes up for in compelling economics and aligned incentives. There is a strong social phenomenon at work behind each tip, in which viewers compete for the streamers’ attention by gifting higher value gifts. The competitive bidding nature of this model is highly profitable – according to different sources, a live streaming platform can be self-sustaining with only the top 4% of its users. Moreover, because creators receive immediate feedback from their viewers, they’re incentivized to broadcast higher quality content more frequently. As a result, the business model leads to a steady supply of content – something North American live streaming apps struggle with – and reinforces network effects.

Valuation

The market is currently pricing YY Live at a 2018 EBIT multiple of ~5.0x, which I believe is incredibly cheap for a business that grew its topline at 18% this year, earned a 24% operating margin, and has a network-effect moat in the Chinese market.

I use a SOTP approach to valuation and reach per ADS valuation range of $75 to $85. The key assumptions include:

  • US$40/ADS for YY Live, based on an 8x EBIT multiple on forecasted 2019 financials
    • The forecasted 2019 financials assume a 5% growth in the number of paying users (~35% CAGR growth from 2015 to 2018) and a flat ARPPU growth
    • The applied 11x EBIT multiple is at a >50% discount to the 2019E EBIT multiple of its closest competitor, MOMO
  • US$15/ADS for Huya, based on the current market capitalization and YY’s 39% shareholding in Huya, applying a 30% holding company discount
  • US$26/ADS for Bigo, based on the US$2.1bn acquisition valuation

Figure 4 – Sum-of-the-parts Valuation Summary

A bull case of YY, which sees more consolidation in the Chinese market and better-than-expected growth in the overseas market, suggests a per ADS range of $110 to $120. A bear case that envisions a slowdown in the Chinese market, greater competition in the e-sports market, and a 40% write-down in Bigo’s valuation suggests a range of $50 to $60.

My margin of safety is rooted in: i) my belief that YY Live’s durable advantage in its existing network is intact and will continue to drive cash flows to fund growth; ii) the strong track record of the business model, proven first by YY Live and now being exported to larger and underpenetrated markets; and iii) a proposed buyout by David Li in 2015 take YY private at a valuation of $3.7 billion or $68.50 per ADS (7% higher than the current share price), which provides a soft floor to the share price.

Key Risks

1) There exist regulatory risks in many forms, such as China’s strict controls over gaming licenses and free speech. Now, broadcasters streaming news and entertainment require licenses to operate. State data will also be used to limit underage gaming in China. While YY has been able to operate a profitable business in YY Live successfully since 2012, regulation remains a real risk. A push into foreign markets mitigates some of this risk.

2) Greater than expected competition in foreign markets may pressure Bigo’s growth. I see this risk as partly mitigated by Bigo’s first mover advantage in several markets.

3) Continued uncertainty around Tencent’s plan for its stakes in Huya and Douyu. I model a HoldCo discount to partly account for this.